Savills Netherlands
Autumn 2025
How Grid Constraints Are Shaping the Dutch Industrial and Logistics Market
Electricity Demand
Introduction
Conclusion
The Grid
Congestion
Follow Us
Savills market intelligence content is designed to engage and immerse users in interactive experiences that are much more captivating than the surface-level, flat reports provided by printable media such as pdfs. Each Savills Netherlands report harnesses the power of a web browser to tell the rich, engaging story of the Dutch real estate market. When printing, you would lose the interactions and animations that make the content a digital experience. In addition, due to our local ESG roadmap, we want to discourage printing as much as possible. Therefore, we don’t offer hard copy or pdf reports anymore.
All content © copyright 2024 Savills. All rights reserved. Savills Nederland Holding B.V., established and registered in the Netherlands. Located: Claude Debussylaan 48, 1082MD Amsterdam. Chamber of Commerce (KvK) number: 33202244.
This Report
Contents
Claude Debussylaan 48, 1082 MD, Amsterdam +31 (0) 20 301 2000
Get in Touch
Savills Beds Special 2024
Dutch Life Sciences
The Office Market of the Future
Logistics Confidence Index 2024
Market in Minutes Q1 2024
Other Reports
Key Findings
Invisible Women in Real Estate
Market in Minutes Q3 2024
Real Estate Solutions
Let's get started...
Out Of Power
But Not Out Of Options
Savills examines the impact of grid congestion on the Dutch industrial and logistics real estate market. Although all sectors are affected, grid capacity constraints are particularly severe in the industrial and logistics sectors. These constraints will limit the future supply of industrial property, resulting in significant consequences for the Netherlands' economy and its manufacturing and industrial base.
Across the Netherlands, grid congestion is increasingly acting as a barrier for businesses seeking to expand or relocate. The rapid electrification of the Dutch economy, combined with a push toward greater self-sufficiency in electricity generation, is intensifying the mismatch between demand and available capacity. Crucially, the challenge is not always rooted in physical grid limitations. In many cases, the bottleneck arises from the contractual over-allocation of capacity to existing users. While grid operators have insight into these patterns, regulatory and contractual obligations mean this reserved capacity cannot simply be reassigned to new entrants.
Physical and contractual capacity constraints
Grid capacity issues are a nationwide concern. For the logistics real estate market, this means that 66.4% of logistics properties are situated in Postal Code 6 (PC6) areas with congestion in consumption. Additionally, 50.3% of logistics properties are in areas facing congestion in feeding electricity back to the grid (feed-in congestion). Strikingly, almost one in two logistics properties face both forms of congestion.
More than half of logistics properties experience grid capacity issues
Demand is highest in areas with uncontested access to electricity
As of Q3 2025, only 3.7% of logistics stock is vacant in areas with electricity available for consumption, compared to 6.9% in congested areas. The contrast is even more pronounced in regions affected by feed-in congestion: 7.1% of logistics stock in these areas is vacant, versus just 4.4% in areas where feed-in remains unconstrained.
Vacancy 3.7% in zones with electricity available for consumption, versus 6.9% in congested zones.
Demand peaks with power.
Electricity consumption mainly depends on business activities rather than building-specific features. Factors such as business type, operating hours, and, in some cases, location influence electricity demand than building age or size. For logistics properties, only 0.5% of the variation in electricity use can be explained by building age, and 2.2% for industrial properties.
Electricity consumption depends on business activity
Energy Hubs are becoming more viable due to changes in national energy legislation. Additionally, on-site solar PV installations combined with battery storage can significantly alleviate the tension caused by grid capacity constraints. The financial implications are significant, with a combined PV and battery system with a backup generation quickly requiring several hundred thousand euros in investment. Investments in these systems are, however, essential, not only to ensure operational stability, but also to safeguard rental income, as insufficient electricity capacity can make properties unattractive to tenants.
Logistics and industrial properties as a solution
5
4
3
2
1
Businesses across the Netherlands, seeking to expand or increase their electricity use or generation, are encountering the limits of the national grid. A few years ago, only a small number of new developments stalled due to transport scarcity (in Dutch: transportschaarste), often because of contractual restrictions, even when the physical network was in place. Today, scarcity has become the norm with grid-related bottlenecks escalating quickly.
Congestion stems from several converging forces. The rapid electrification and digitisation of the broader economy and built environment are creating higher demand. The expansion of electric vehicle infrastructure, the growth of data centres, and the electrification of industrial processes all place significant pressure on the grid.
Real Estate Can Help Solve Grid Congestion
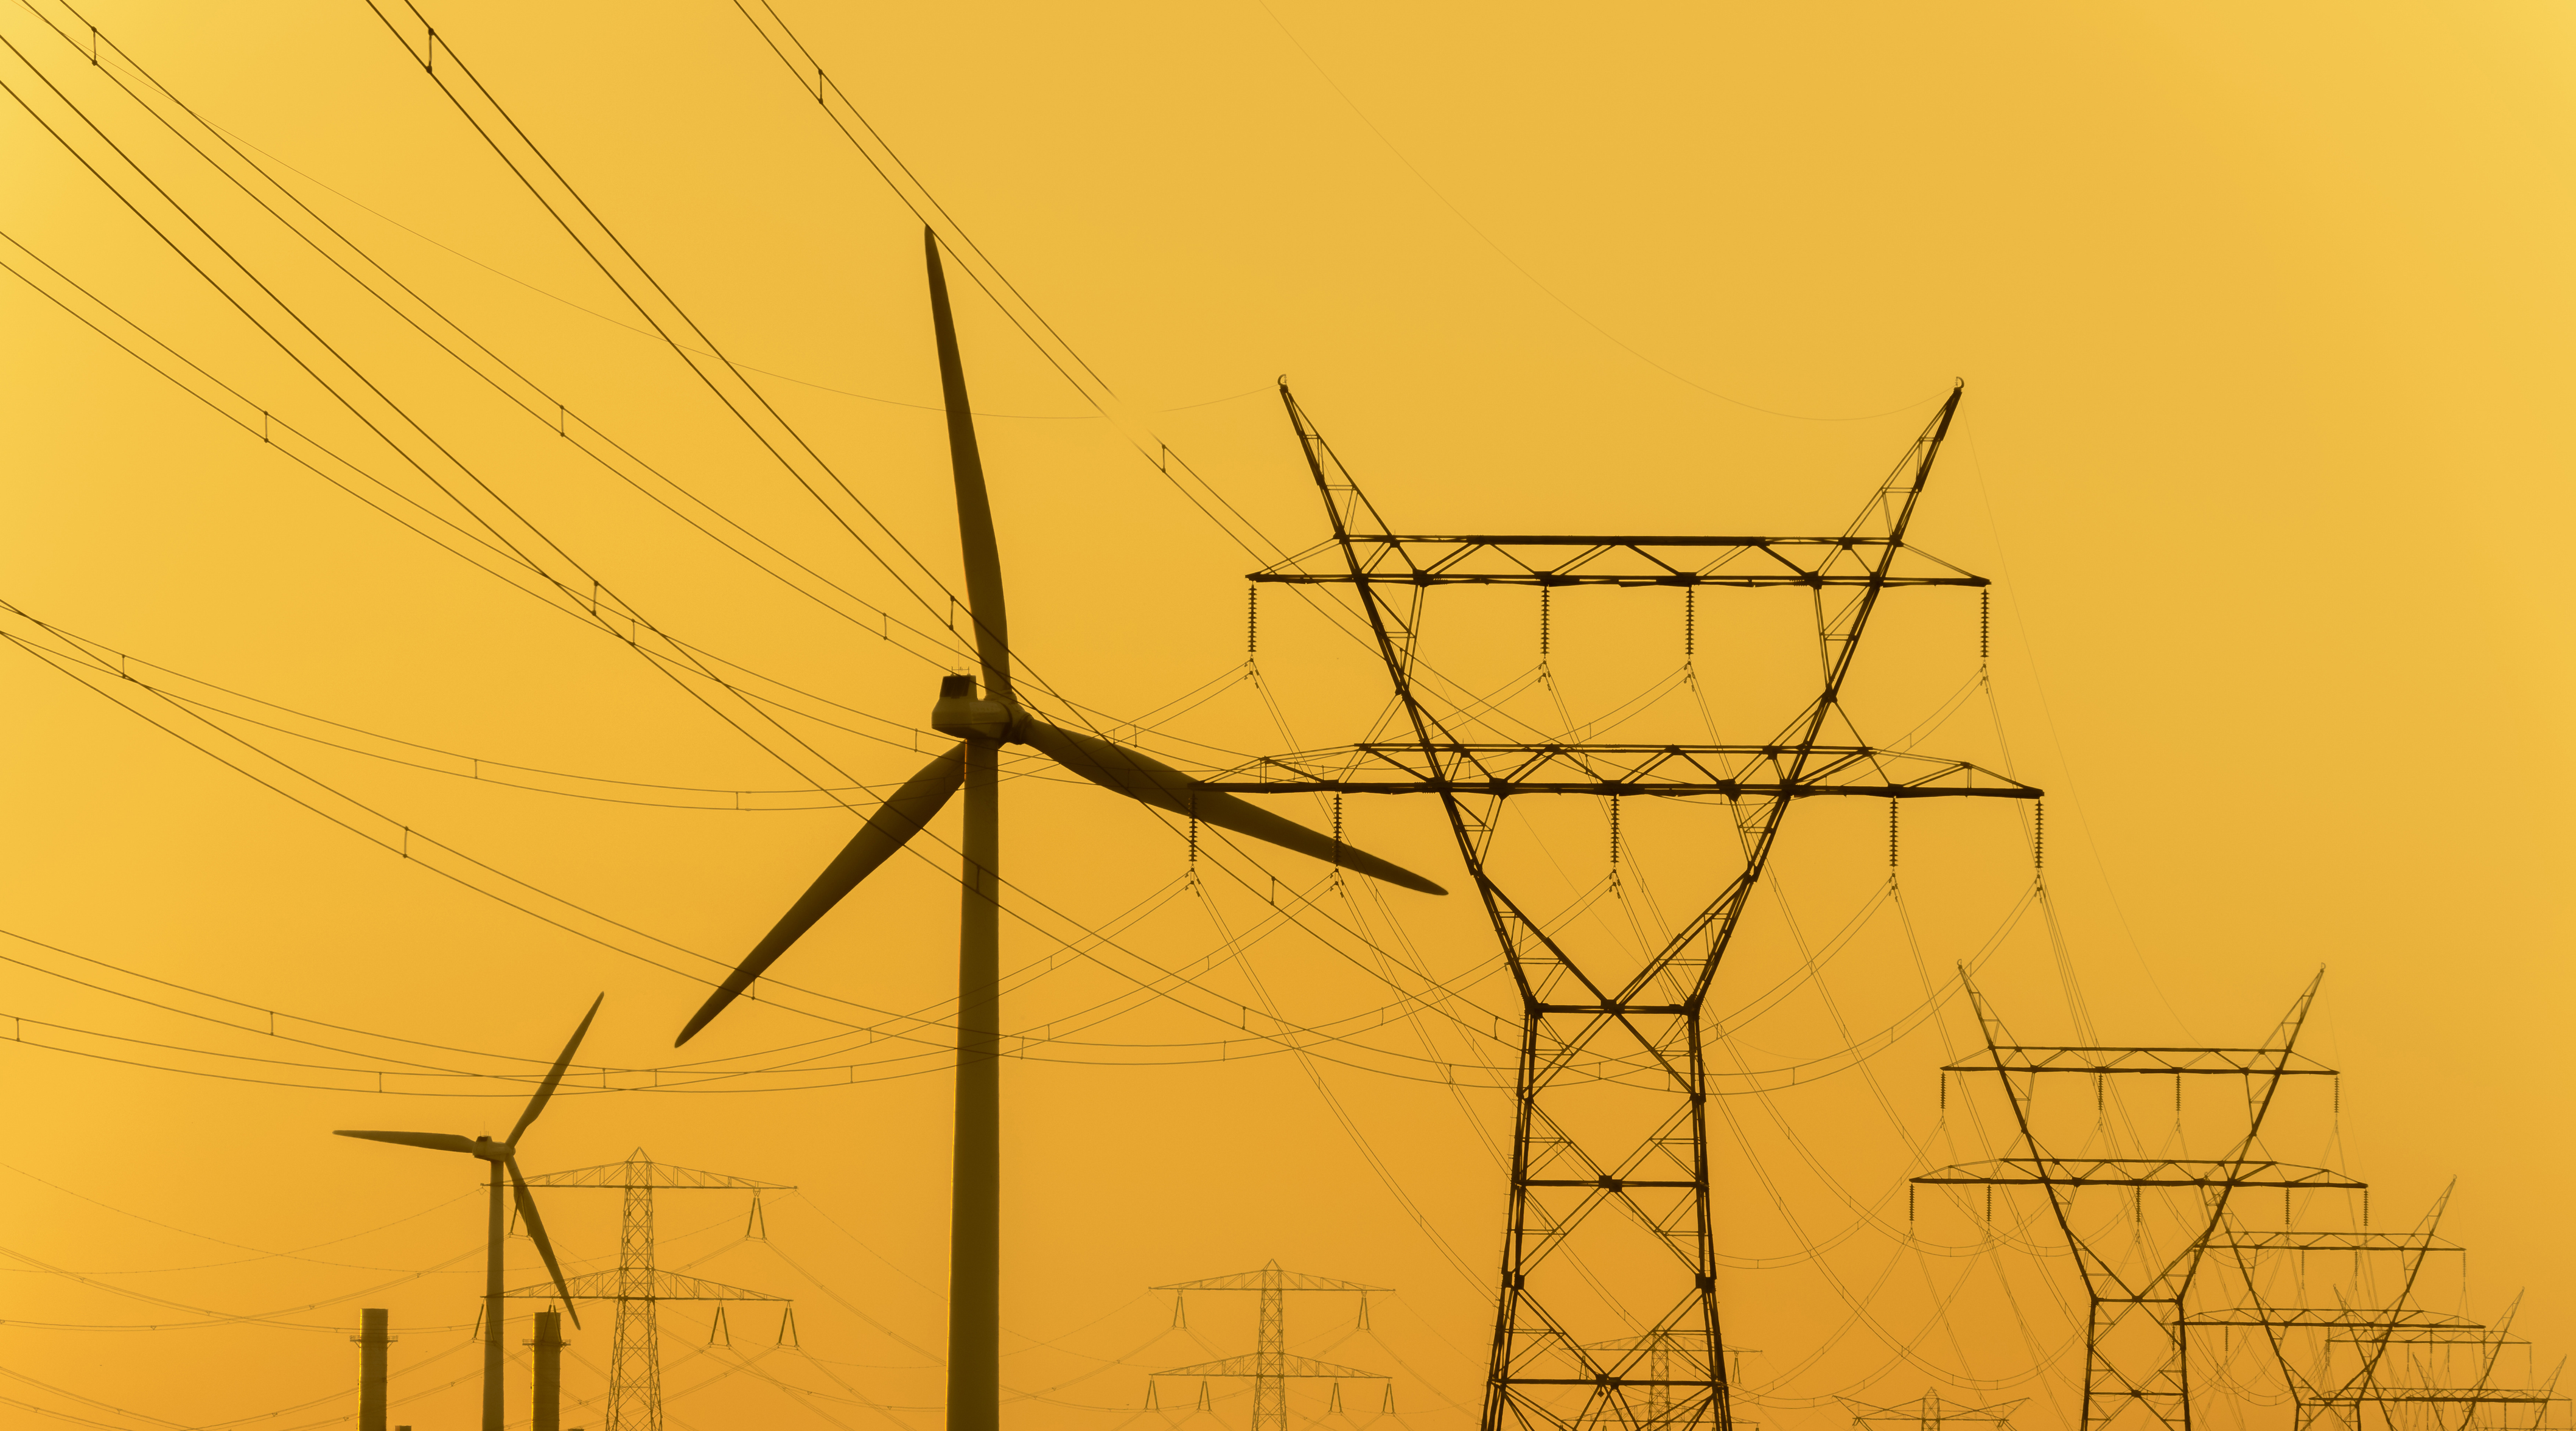
Between 2000 and 2024, total energy consumption in the Netherlands decreased by 16.7%, primarily driven by efficiency measures and greater awareness of energy use. At the same time, the country is transitioning toward a more self-sufficient energy system. It is reducing its reliance on imported fossil fuels, with renewables accounting for a rapidly growing share of the mix. Yet this expansion of renewable electricity production places added strain on the electricity grid. Solar and wind output are inherently variable, and without large-scale storage, it remains challenging to balance renewable supply with electricity demand and broader energy needs.
introduction
Grid congestion shows little sign of easing as the Dutch industrial base continues to expand. Because the constraints are structural, they will impact the real estate market. From the ambition to build 100,000 homes annually to ensuring companies have sufficient business space to grow, the entire property market will be affected. This report provides an overview of the Dutch electricity grid, its key stakeholders, and their role in the industrial and logistics real estate sector. We begin by examining electricity demand across the Dutch industrial and logistics landscape. We then look at how the grid operates and identify the root causes of congestion that are specific to the Netherlands. Finally, we consider the role that industrial and logistics properties can play in addressing the country’s ongoing grid challenges.
Two Terms, One Problem? In Dutch energy debates, the terms grid congestion (in Dutch: netcongestie) and transport capacity scarcity (in Dutch: transportschaarste) are often used interchangeably, but they describe different issues.
The Limits of Grid Capacity Transport capacity scarcity is a specific form of congestion. It occurs when the grid lacks sufficient capacity to transfer additional electricity to or from a location without overloading the system. This can happen even when a physical connection is in place, because the contractual or operational capacity is already allocated. In practice, it often reflects a more theoretical limit; companies reserve grid capacity through contracts, even if they do not fully use it. Grid operators, such as Enexis, have insight into these patterns, but regulatory and contractual obligations mean this reserved capacity cannot simply be reassigned to new consumers. Grid congestion, by contrast, is broader and more physical. It occurs when parts of the network become overloaded or constrained due to high demand, limited infrastructure, or both, often at peak times of the day. In the Dutch context, transport capacity scarcity is one of the most visible and urgent expressions of grid congestion.
Grid Congestion & Transport Capacity Scarcity, What’s the Difference?
explainer
Statistics Netherlands (2025); adapted by Savills Data, Intelligence & Strategy (2025).
Electricity consumption in the Netherlands has remained relatively stable, while electricity production is increasingly shifting toward renewable sources.
The Dutch Electricity Grid
BAck to the top
Wouter Van ‘t Grunewold
Market Intelligence Analyst
Regression analysis shows no straightforward relationship between property size, BREEAM certification, and electricity use. While BREEAM certification does not directly influence consumption, the requirements often encourage solar photovoltaic (PV) installation, which can offset demand, though only intermittently, depending on weather conditions. In practice, 99.5% of electricity use in logistics properties is explained by occupier activity rather than building characteristics.
Logistics Properties Use the Most Electricity
Heavy Industrial and Logistics
THE MAIN DRIVERS OF DUTCH ELECTRICITY DEMAND
Estimating Electricity Use in Dutch Industrial and Logistics Sectors
Estimating the exact electricity consumption of the Dutch industrial and logistics sector is highly challenging, given the limited availability of reliable data on electricity usage. The Netherlands Organisation for Applied Scientific Research (TNO, 2025) evaluated energy consumption in commercially occupied buildings across the country. By integrating these results with Savills’ industrial and logistics property-specific data, we can estimate the sector’s electricity consumption.
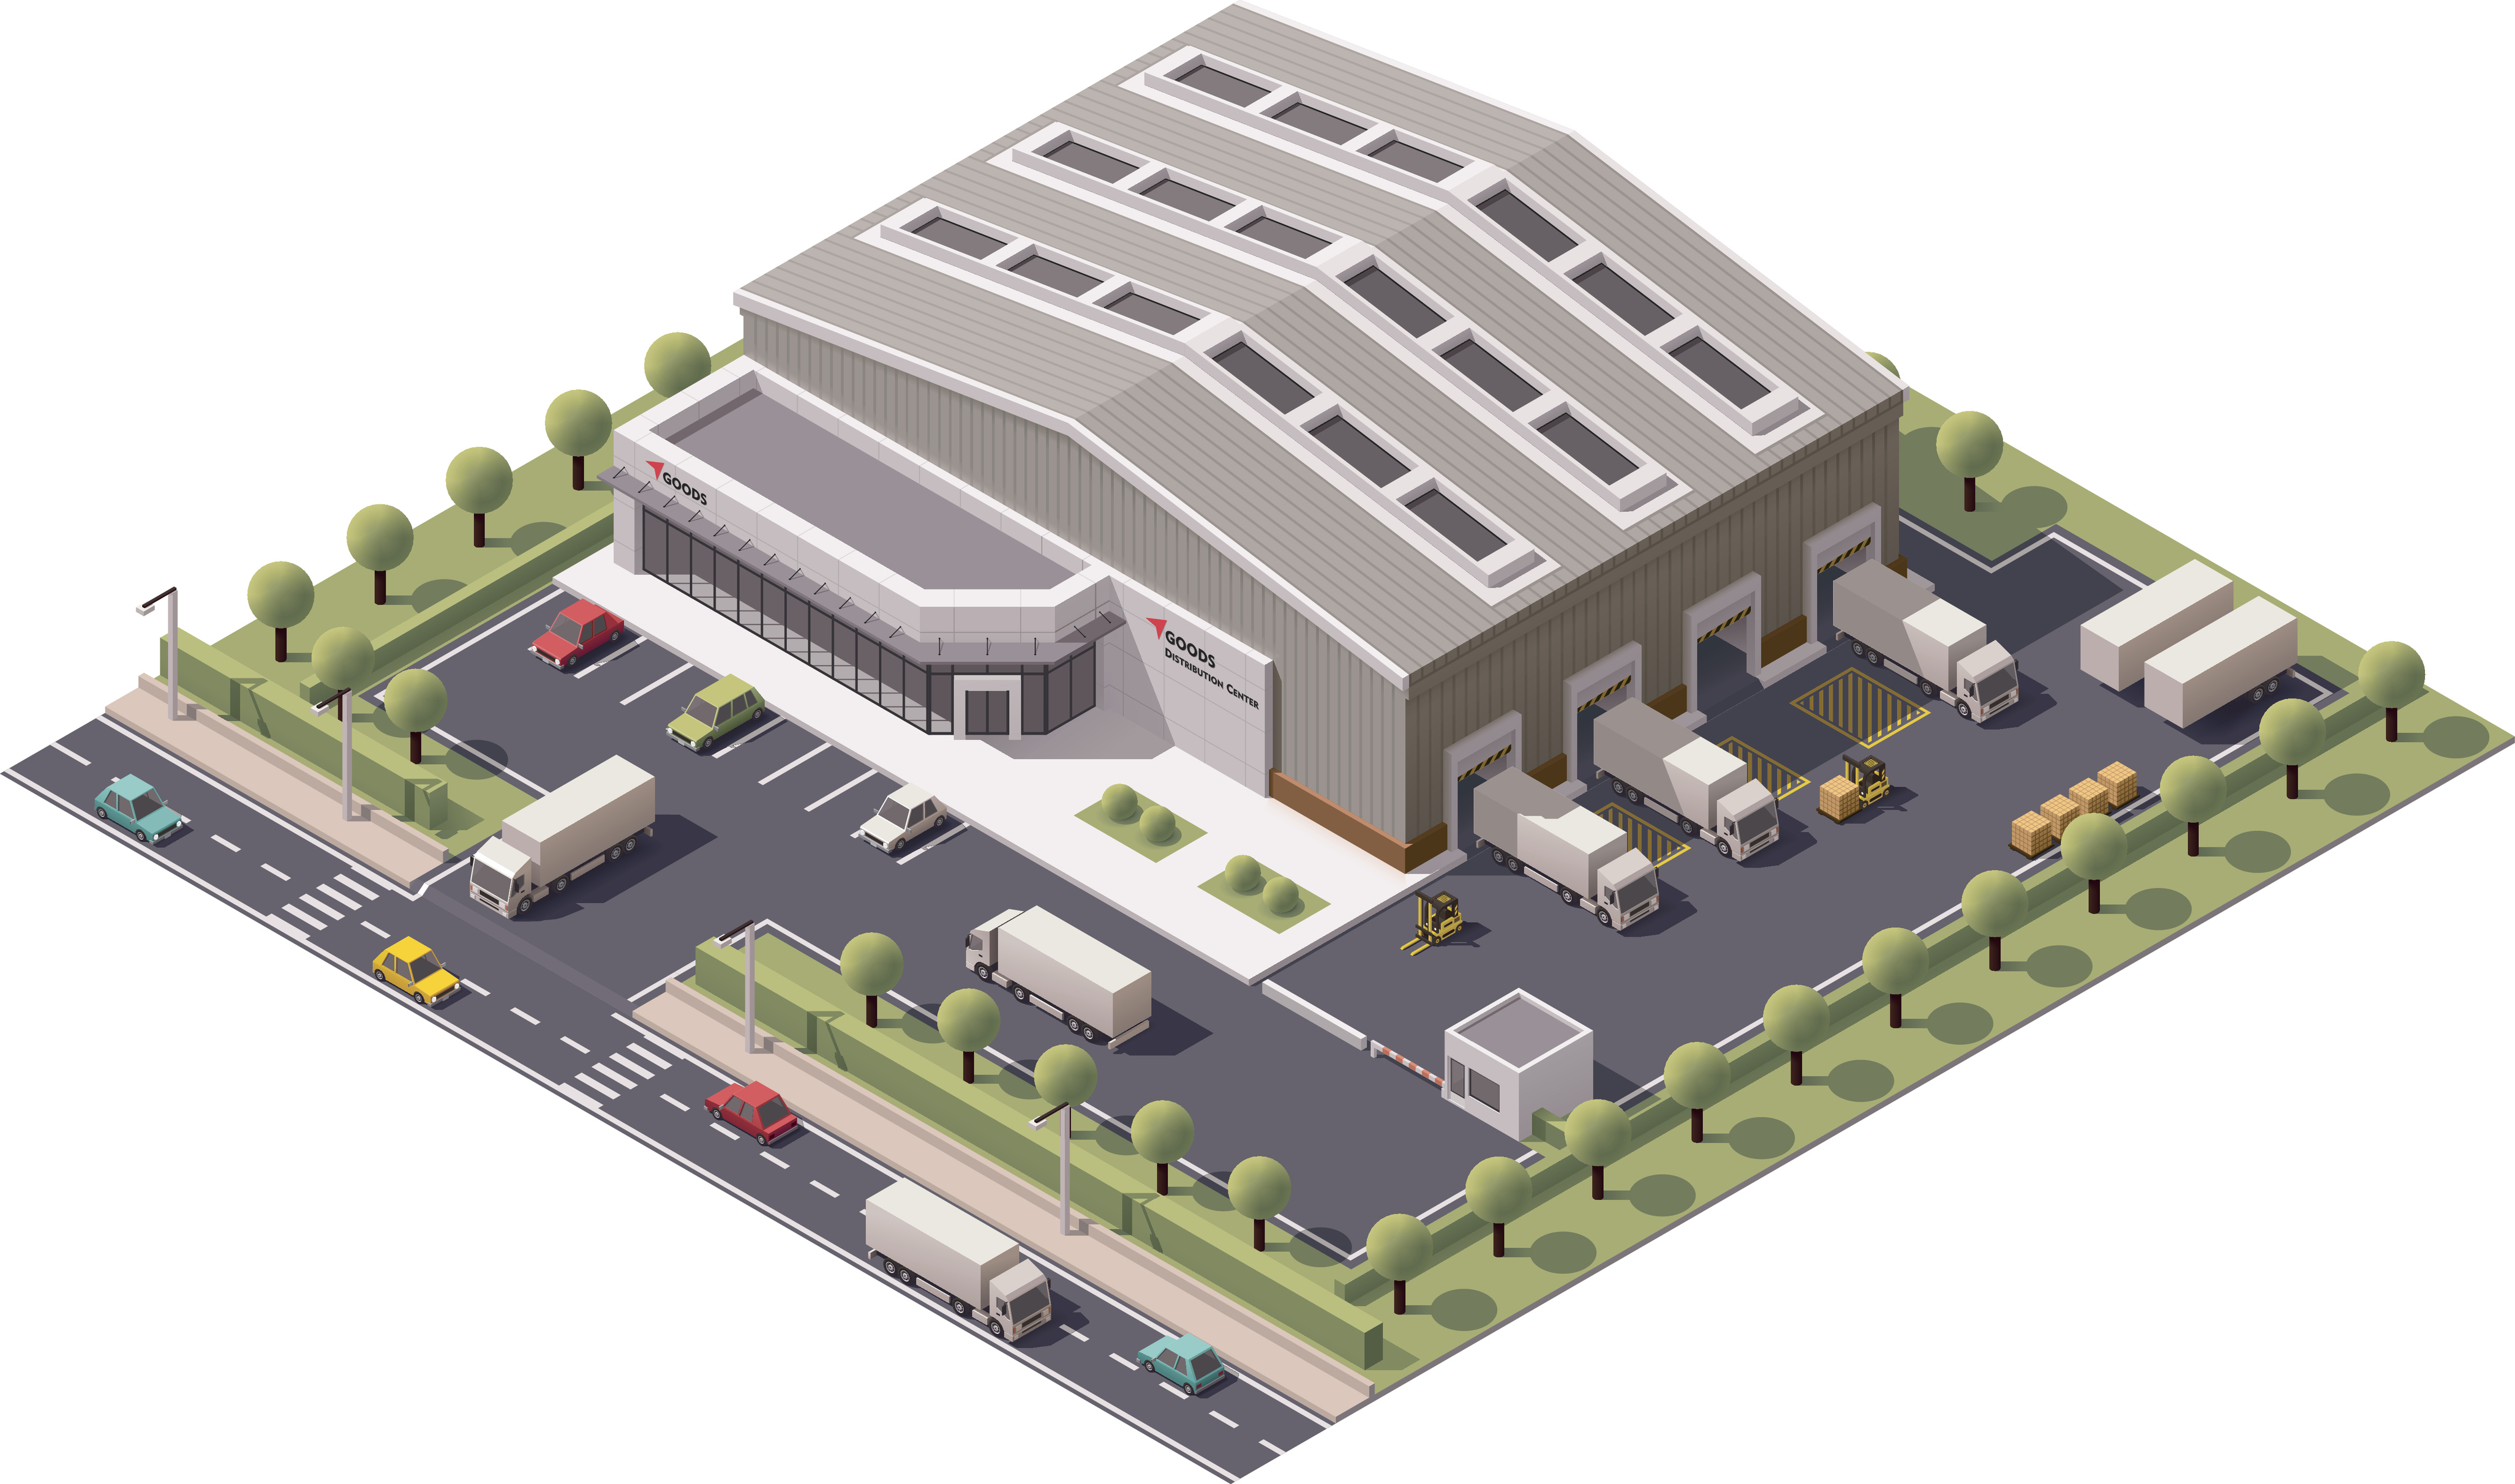
Logistics Logistics real estate refers to properties designed for the storage, distribution, and handling of goods. This includes warehouses, distribution centres, and fulfilment facilities that support supply chain operations for manufacturers, retailers, and e-commerce companies. Such properties typically offer a lettable floor area of 10,000 square meters (sq m) or more, though smaller last-mile facilities have become increasingly common. They generally include at least three loading docks and a minimum clear height of 8 metres. This also includes cold storage facilities and refrigerated warehouses.
Industrial Industrial real estate covers a broad range of properties primarily used for manufacturing, assembly, and small-scale storage or distribution. These facilities often combine multiple functions under one roof and, depending on activity levels, tend to operate at lower densities in less dynamic locations. Savills distinguishes several sub-sectors within the industrial segment, including heavy industrial, logistics, data centres, car dealerships and garages, and light-industrial properties. Light-industrial assets account for most of the Dutch industrial real estate market, representing 93.7% of the total stock. While data centres can arguably be considered a distinct sector, their typical location on business parks, along with their specific energy and infrastructure requirements, places them in direct competition with other sub-sectors within the industrial segment.
Definitions of Industrial and Logistics
Throughout this report, we use the terms industrial and logistics real estate, which are defined as follows:
Three factors drive this intensity. Firstly, these regions host a dense cluster of refrigerated facilities. Large volumes of perishable and temperature-sensitive goods, including fruit, meat, fish, dairy products, flowers, chemicals, and pharmaceuticals, move through their warehouses. Examples include Lineage’s cold storage facility on Tsugarusstraat 5 and C. Steinweg Group’s temperature-controlled warehouse for peanuts on Elbeweg 101, both in Rotterdam. Secondly, Rotterdam, Moerdijk, and Schiphol are key intermodal transfer hubs, with frequent transfers between transport modes such as ship to truck, air to rail, and other points. This creates continual internal goods movements requiring energy-intensive equipment such as forklifts, dock lifts, and overhead cranes. Thirdly, many logistics sites in Rotterdam and Schiphol operate continuously because of their strategic roles in regional and global supply chains. These 24/7 operations drive both higher and more consistent electricity demand..
Logistics never sleeps.
Consumer-goods logistics hubs, such as Bleiswijk–Waddinxveen, Utrecht–Nieuwegein, and Venlo–Venray, have markedly lower electricity demand. In these areas, 45.3%, 31.1%, and 36.9% of logistics properties, respectively, consume less than 530,000 kWh per year. Usage at this level can in theory be supported by a 3x250 A connection (147 kW at a power factor of 0.85), assuming operations run 14 hours a day, five days a week.
Where buildings do make a difference, age is the main factor. Older stock is often still gas-heated, keeping electricity demand lower, whereas newer assets are increasingly equipped with heat pumps, adding to the electrical load. This shift interacts directly with grid congestion: owners seeking to move away from gas and cut nitrogen emissions may find their ambitions constrained by limited electrical capacity.
Age Shapes Energy Demand
Source: Netherlands Organisation for Applied Scientific Research (2025); Savills Data, Intelligence & Strategy (2025)
Logistics hotspots Rotterdam, Schiphol and Moerdijk are relatively the most electricity-intensive.
Innovation needs infrastructure: Electricity use in logistics buildings depends far more on occupier activity than on the building itself. A highly sustainable, state-of-the-art facility may appear theoretically aligned with net zero ambitions. Nonetheless, if its tenants’ operations are energy-intensive, actual consumption can undermine energy intensity targets.
Ecosystem is everything: Property owners should assess operations, tenant activities, and the energy intensity of logistics processes when evaluating the performance and upgrade potential of a property. Local grid capacity should also be considered, as constraints are closely linked to usage patterns. Two properties with similar physical specifications can experience different levels of grid access risk depending on their tenant mix. Flexibility will increasingly define resilience. In future, logistics assets with on-site power generation or storage will be better able to support efficient operations, absorb grid shocks, and maintain long-term value.
What does this mean?
Beyond logistics, heavy industrial facilities typically consume far more electricity than smaller light-industrial units. While detailed data on Dutch data centres remains limited, most estimates suggest their energy use matches, or even exceeds, that of heavy industry, with some studies indicating levels of up to 1,550 kWh per sq m per year, depending on the facility’s scale and efficiency.
Even as demand for digital capacity continues to rise, average electricity use in data centres is not expected to increase significantly. Continuous efficiency gains, through advanced cooling systems, renewable integration and waste-heat recovery, help offset higher computational loads. In comparison, the logistics sector has only recently begun addressing its own energy footprint, driven mainly by grid congestion and operating-cost pressures rather than regulation or public scrutiny.
Similar to logistics, occupier activity accounts for most of the variation in industrial electricity use. Building characteristics accounted for just 2.2%. Among those characteristics, age and size have the most pronounced effect: each additional year adds 0.092 kWh/sq m/year to total consumption, and each extra square meter adds 0.0046 kWh/sq m/year. Interestingly, BREEAM In-use certification shows no measurable link to higher or lower electricity consumption.
2.2%
Building characteristics explained just 2.2% of total variation in industrial electricity use.
Each additional building year added 0.092 kWh per sq m per year to total consumption.
0.092kWh
Every extra square metre increased annual use by 0.0046 kWh per sq m.
0.0046kWh
Differences in Electricity Use in the Industrial Sector.
The analysis reveals that building characteristics contribute to less than 5% of electricity usage in industrial and logistics properties. Demand is driven instead by occupier-specific factors such as operating hours, machinery, business scale, and approaches to energy efficiency. These elements shape consumption far more than the physical design of a building.
For developers, owners, and tenants, it is essential to evaluate electricity requirements strategically and early, whether during site selection, building design, or lease negotiations. Some operations require power loads that go beyond standard grid connections or on-site solutions, especially in regions already experiencing capacity constraints. This need for foresight will be reinforced by Energy Performance of Buildings Directive (EPBD) IV, which is set to tighten requirements on energy performance and electricity use across all European buildings. Although industrial and logistics properties are primarily driven by occupier demand, compliance pressures will increasingly extend to them as well, making proactive planning indispensable. Property owners should collaborate with tenants to model a range of electricity-use scenarios, thereby avoiding tightening grid limits and rising energy costs. This approach not only helps avert operational bottlenecks but also unlocks opportunities. Properties that are grid-resilient, energy-flexible, and power-smart will be more valuable and better aligned with decarbonization goals, shaping institutional investment decisions.
What’s next?
Logistics - Average Electricity Use per sq m per year (in kWh)
Savills Data, Intelligence & Strategy (2025)
The heavy industrial sector has the highest average electricity use per square meter per year, followed by logistics.
Only 0.5% of the variation in electricity use per square meter per year in logistics properties is explained by building-specific characteristics such as age
Industrial - Average Electricity Use per sq m per year (in kWh)
The logistics sector is one of the most electricity-intensive in the Netherlands. In-use logistics buildings consume an average of 192.7 kWh per square meter annually, significantly higher than offices (79.8 kWh/sq m/year), hotels (84.9 kWh/sq m/year), and retail (113.5 kWh/sq m/year). This heavy demand makes grid capacity issues especially acute for logistics.
Electricity use within the sector varies widely by location, influenced by occupiers and the function of each logistics area. Rotterdam, Moerdijk, and Schiphol are particularly power-hungry, with average consumption in Rotterdam logistics buildings up to four times the national average for logistics.
Understanding the Grid
Stakeholders and Relationships
The Dutch electricity grid is both complex and highly organised. In 2024, unplanned disruptions rose 16.7% year over year, according to Netbeheer Nederland. Even so, the grid remains one of the most reliable in Europe, with the percentage of time that the electrical grid is operational and providing a reliable supply of electricity reaching 99.99%. This resilience reflects continuous investment, strong maintenance practices, and close coordination among the many stakeholders that keep the system running.
Dutch Electricity Grid Proves Resilient
The grid itself can be divided into three main components, distinguished by voltage level, with each segment overseen by specific stakeholders responsible for ensuring smooth and reliable operation.
Climate change is significantly impacting agricultural practices in the Netherlands. Farmers are facing challenges such as unpredictable weather patterns, increased frequency of extreme weather events, and rising sea levels. To combat these issues, Dutch farmers are adopting resilient agricultural practices, such as the use of drought-resistant crop varieties, improved water management systems, and sustainable land-use strategies. Research institutions and government bodies are working together to develop innovative solutions to mitigate the effects of climate change on agriculture.
Real estate implications: Climate-resilient agricultural practices require investment in new infrastructure and technology. Real estate investors and developers should focus on properties that support sustainable and resilient farming methods. This includes irrigation systems, flood defences, and energy-efficient buildings, which can enhance the long-term value and sustainability of agricultural properties. Climate change could also benefit some alternative agricultural sectors, like viticulture.
Impact of climate change on Dutch agriculture
06
The Netherlands is at the forefront of implementing a circular economy in food production. Efforts to reduce food waste are evident throughout the supply chain, from production to consumption. Innovations such as food-sharing platforms, upcycling food waste into new products, and biodegradable packaging are becoming mainstream. This holistic approach not only conserves resources but also creates new economic opportunities.
Circular economy in food production
Real estate implications: The circular economy model is influencing the design and operation of food-related facilities. Industrial and commercial spaces are being repurposed for recycling centres, composting sites, and facilities for producing biodegradable packaging. Mixed-use developments incorporating these elements can attract environmentally conscious businesses and consumers, enhancing the appeal and sustainability of the properties. An example is the initiative Zero Waste Zuidas, aiming to have Amsterdam’s Central Business District waste free by 2030.
05
In addition to plant-based proteins, the Netherlands is exploring other alternative protein sources such as insect-based and lab-grown meat. Companies like Protix are leading the charge in producing insect-based proteins for human consumption and animal feed. Research and development in cultured meat is also progressing, with the aim of providing sustainable alternatives to traditional livestock farming.
Real estate implications: The alternative protein sector requires specialised laboratory and production facilities. Real estate developers can capitalise on this by creating biotech hubs and innovation parks tailored to the needs of alternative protein companies. These developments can attract significant investment and foster collaboration between research institutions, start-ups, and established firms.
Alternative proteins
04
The plant-based movement is gaining significant momentum in the Netherlands. Companies like The Vegetarian Butcher and Beyond Meat are leading the way, providing a variety of plant-based alternatives that cater to both vegetarians and flexitarians. The Dutch government supports this shift through various initiatives aimed at reducing meat consumption and promoting a plant-based diet. This trend is driven by health considerations and a growing awareness of the environmental impact of meat production.
Real estate implications: The growth of the plant-based sector is creating opportunities for specialised manufacturing facilities and distribution centres. Retail spaces, particularly in urban areas, are also adapting to the increasing demand for plant-based products by incorporating more plant-based food outlets and dedicated sections in supermarkets. Property owners can benefit from this trend by leasing spaces to plant-based food producers and retailers. Beyond Meat, a leading producer of plant-based meat, has opened a production facility in Zoeterwoude in collaboration with local player Zandbergen World’s Finest Meat. The collaboration makes it possible to meet the growing European demand for Beyond Meat products. The innovative Beyond Meat products are produced in this ultramodern production location called The New Plant.
Plant-based revolution
03
The Netherlands is a global leader in sustainable agriculture, leveraging advanced agritech solutions to boost productivity and reduce environmental impact. Innovations such as precision farming, vertical farming, and greenhouse technology are integral to Dutch agriculture. These methods not only enhance efficiency but also contribute to food security by enabling year-round production. The use of drones, sensors, and AI in farming practices helps optimise resources and minimise waste, making Dutch agriculture a model of sustainability.
Real estate implications: The demand for high-tech agricultural facilities is rising, driving the development of modern, tech-enabled farms and greenhouses. Investors are increasingly interested in agritech parks and hubs, which can attract both local and international agritech firms. Real estate developers should consider integrating advanced infrastructure to support these technologies, enhancing property values and attracting long-term tenants.
Sustainable agriculture and agritech
02
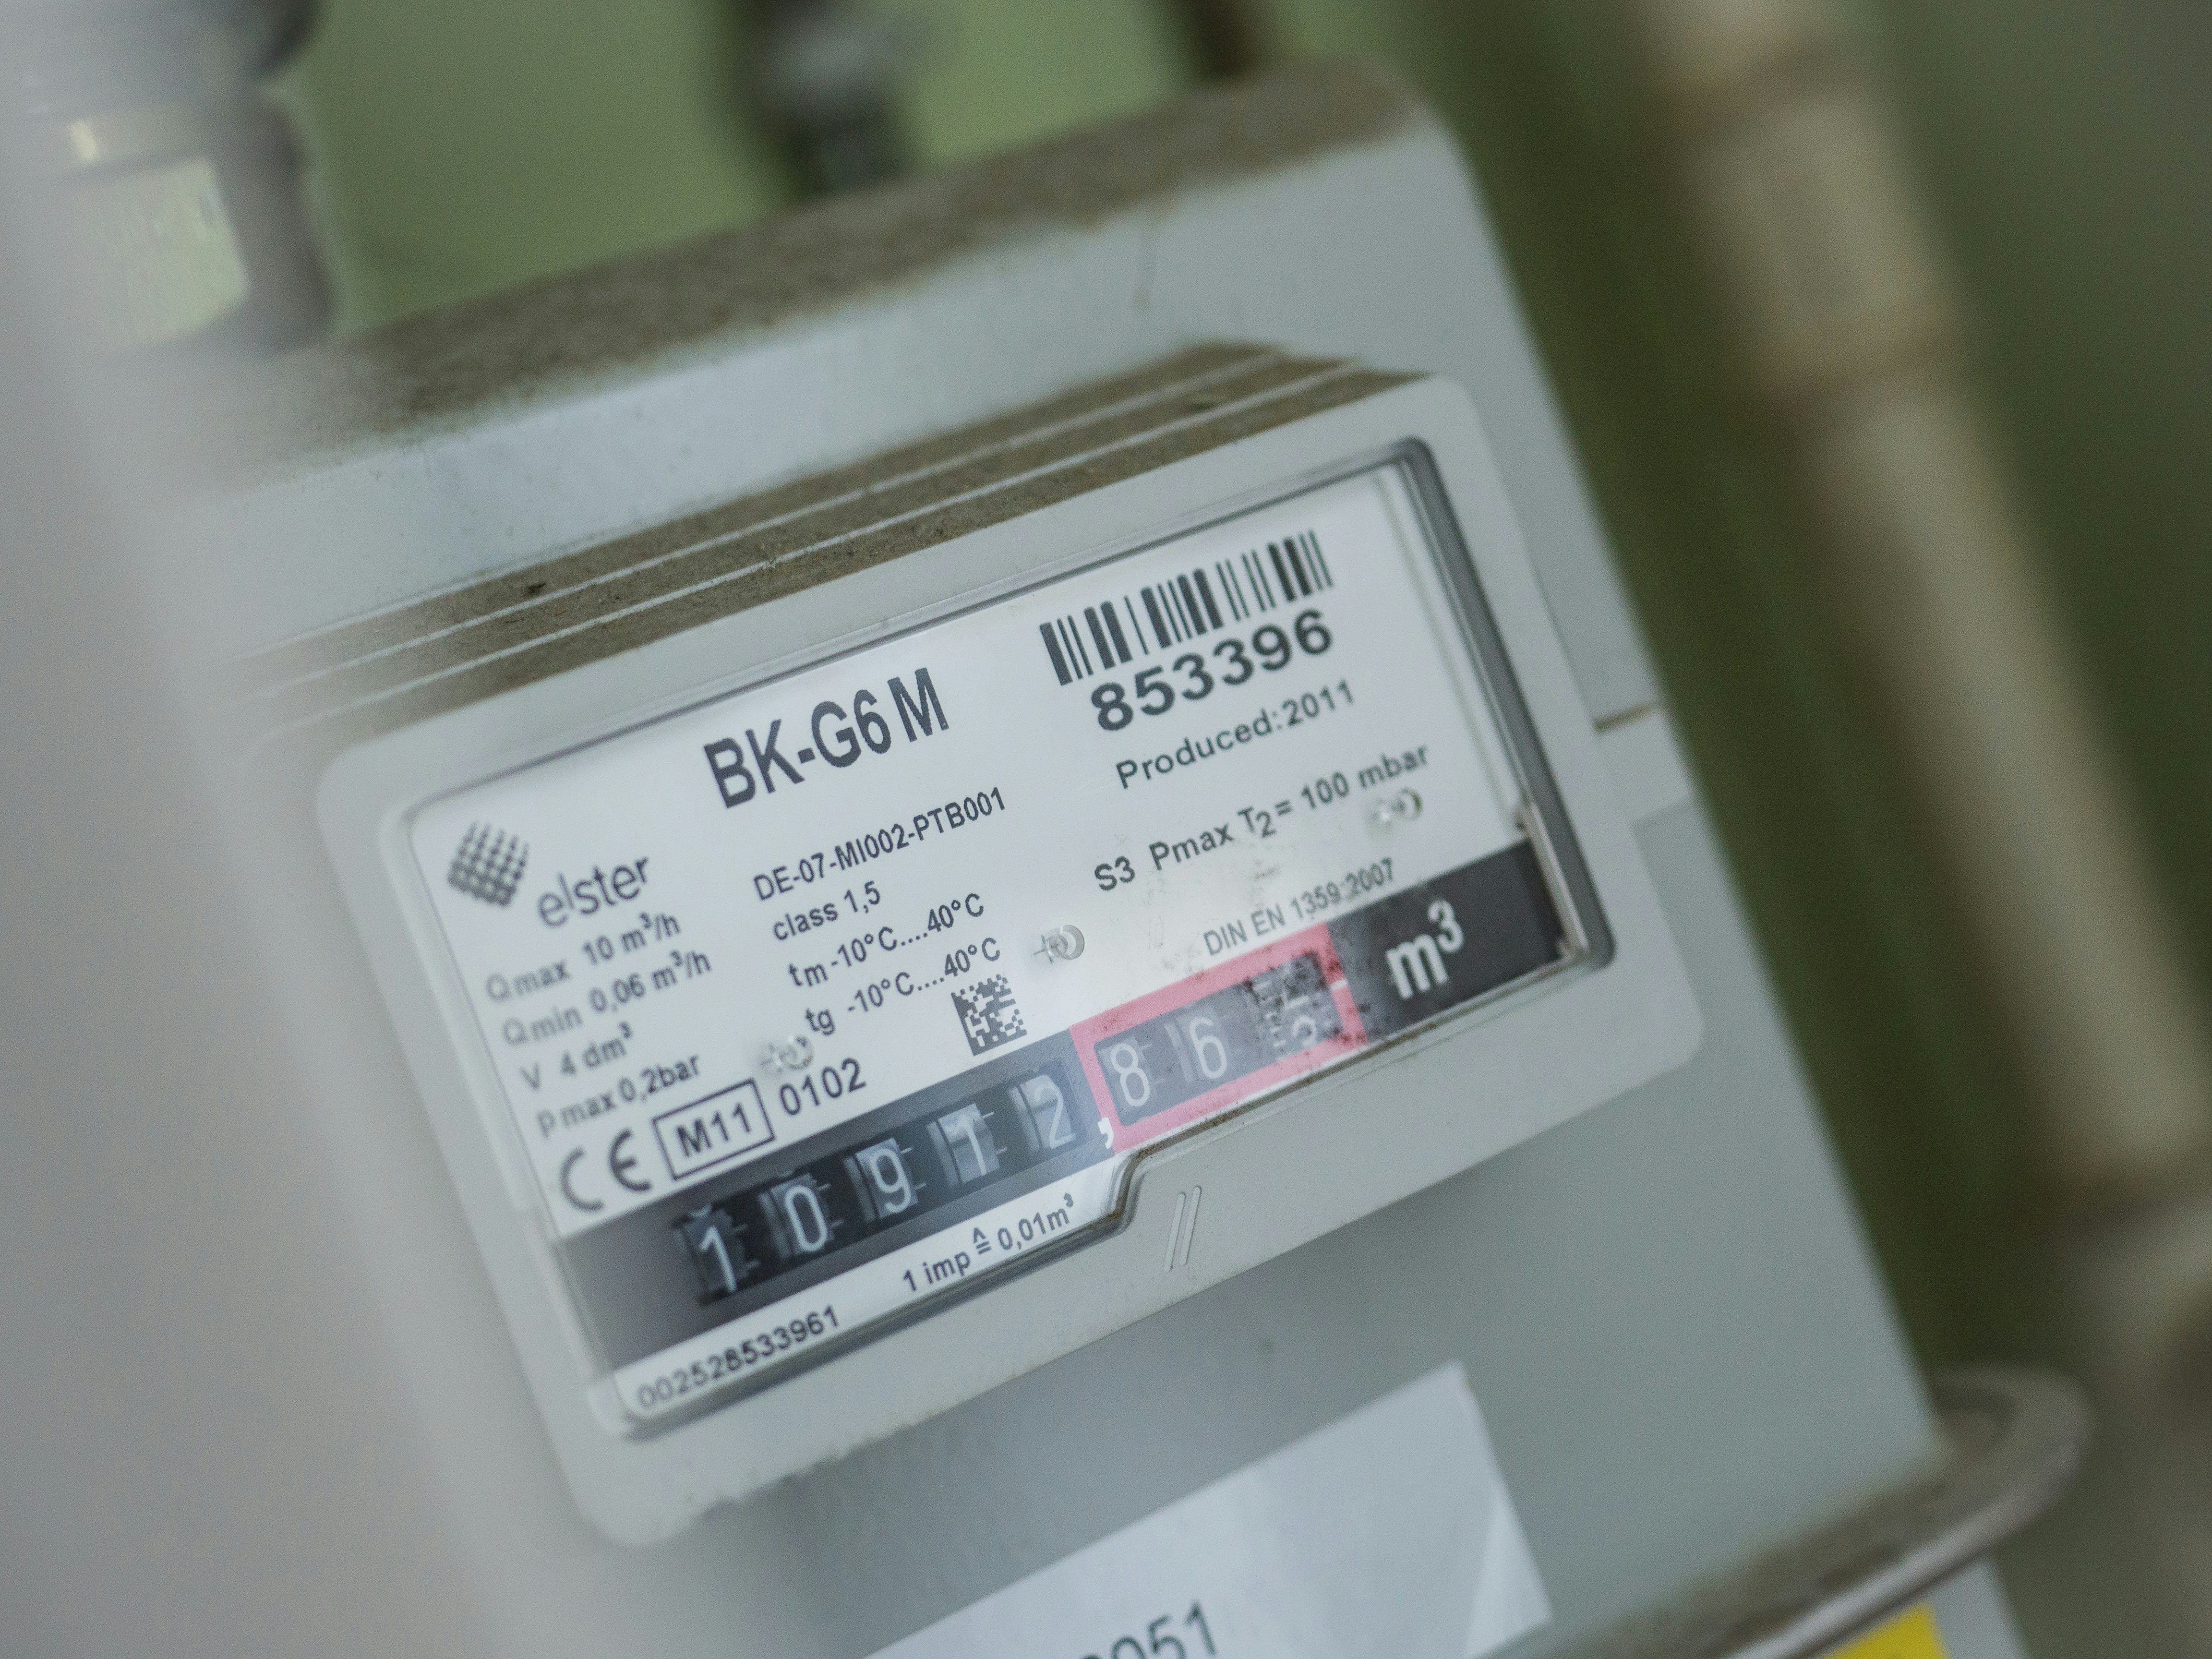
Finally, DSOs manage the low-voltage grid, the most local layer of the electricity system, which delivers power directly to end users. At this stage, electricity is converted from medium to low voltage (below 1 kV) through local transformer stations, often housed in small above-ground buildings. This final step ensures electricity is supplied at a safe and usable level, typically 230 V, for residential, commercial, and small-scale industrial consumption.
Low-Voltage Grid
Once electricity is transferred from the high-voltage grid to regional substations, it enters the medium-voltage network through transformer substations. These grids operate at voltages between 1 kV and 25 kV and are managed by Distribution System Operators (DSOs). DSOs oversee regional distribution, ensuring that households, businesses, and small-scale producers remain reliably connected to the grid. In the Netherlands, DSOs are publicly owned, often through municipal or regional cooperative structures. The three largest operators are Enexis, Stedin, and Liander. Like TenneT, DSOs are prohibited from selling electricity directly to end users. Instead, they function independently of commercial suppliers and focus on providing regulated, non-discriminatory access to the grid for both producers and consumers.
Medium-Voltage Grid
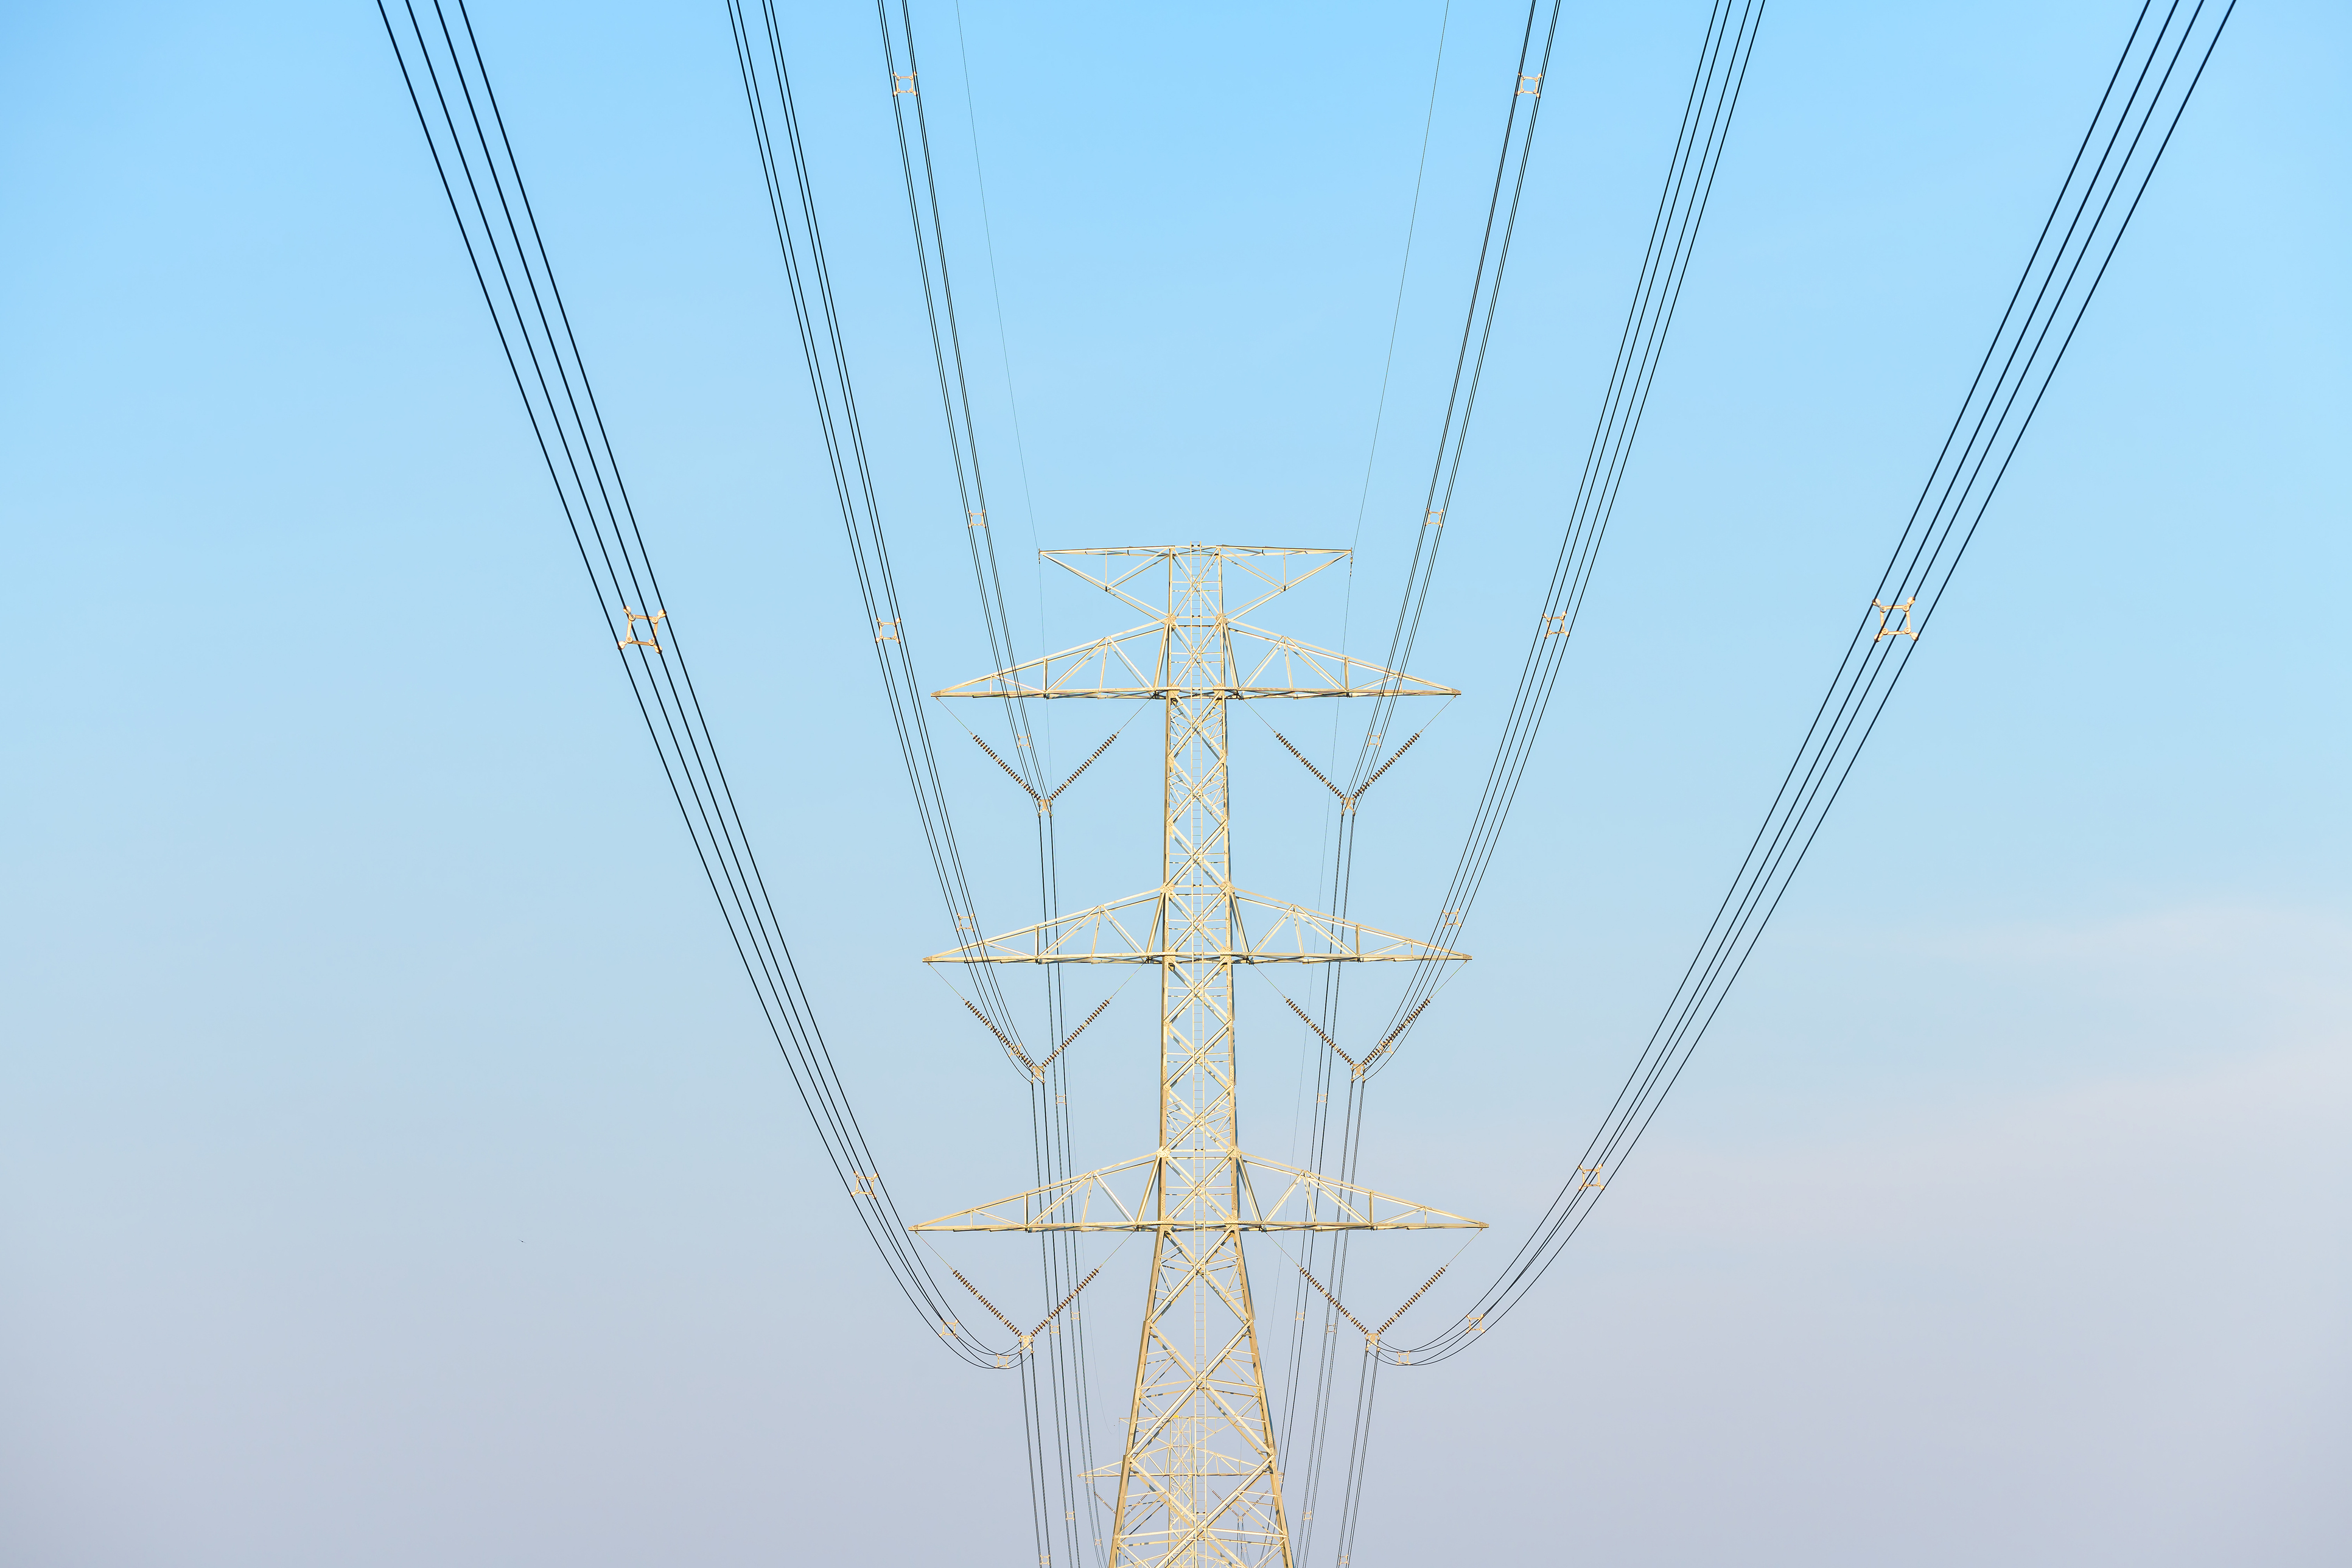
The first component is the high-voltage network, which transmits electricity from primary generation sources. These include offshore wind farms in the North Sea, the nuclear power plant in Borssele, and imports from abroad, which are transmitted to regional distribution points across the country. To reduce transmission losses over long distances, this grid operates at voltages above 25 kilovolts (kV), typically between 110 kV and 380 kV.
Dutch Government Owns TenneT Grid The high-voltage network is owned and operated by the national Transmission System Operator (TSO), TenneT. Its role is to transport electricity from producers such as Shell, Vattenfall, and Eneco to regional distribution systems. Unlike many of its European counterparts, TenneT is wholly owned by the Dutch government. This public ownership safeguards national strategic interests and strengthens governmental influence in long-term infrastructure planning, including the energy transition. Elsewhere in Europe, TSOs are more commonly partly privatised.
High-Voltage Grid
01
Locked Grid Capacity These dynamics highlight the core of the grid capacity and transport scarcity issues now facing the Netherlands. Many logistics and industrial properties reserve high contractual capacities to cover projected peak demand, yet their actual consumption is often far lower. This mismatch prevents DSOs to reallocate capacity to other users. Even when the physical network could technically accommodate more, the reserved capacity remains contractually locked, creating a bottleneck rooted in regulatory and contractual obligations rather than purely physical constraints.
Rising Electricity Demand At the same time, the electrification of logistics and industrial processes is pushing actual demand higher. Many occupiers now need more electricity than their current contracts allow. For example, a logistics property with a 22,000 sq m warehouse and 3,000 sq m of office space may require peak loads of up to 540 kW for typical operations. In practice, usage is often lower, as maximum demand rarely occurs all at once. Smart energy management tools such as load balancing can spread consumption and keep usage in the 300–450 kW range under standard conditions. Still, to safeguard stability and flexibility, the user seeks a grid connection rated at least between 355 and 475 kVA (assuming a power factor of 0.85). This is especially the case for users without on-site generation or storage, or for those not engaged in power-sharing agreements, an approach we explore in more detail later in this report.
Connecting a building to the electricity grid is more complex than simply running a cable from the medium- or low-voltage network. The type of connection depends on the building’s expected electricity demand and the contractual agreement between the DSO and the owner or user. For most logistics and industrial sites, a three-phase connection is required. In the Netherlands, this provides 230 V per phase relative to neutral, and 400 V between phases, allowing for a far greater power capacity than the standard 230 V single-phase connection found in households.
The connection’s current rating determines its maximum capacity. For small- to mid-sized logistics and industrial properties, ratings typically range from 3x80 A to 3x250 A. Larger operations may need a direct link to the medium-voltage grid like a 630 kVA connection or upgrades to existing connections, sometimes supported by on-site renewable energy solutions. These higher-capacity setups are reserved for cases where operational scale or activity demands significantly more power. In a three-phase system, the “3” indicates the number of conductors: a 3x80 A connection can theoretically deliver about 55 kW, while a 3x250 A connection can theoretically provide up to 173 kW. Adding to the complexity, DSOs distinguish between total available power capacity, measured in kilovolt-amperes (kVA), and actual usable power, measured in kilowatts (kW). The kVA figure represents the total electrical power supplied to a property, regardless of efficiency. The kW figure reflects the share of that power effectively consumed by equipment and systems. The gap between the two is explained by the power factor, a measure of how efficiently electricity is used, which for most industrial users ranges between 0.8 and 1. A lower power factor means more apparent power (kVA) is needed to deliver the same real power (kW). For example, a 150 kVA required connection with a power factor of 0.85 translates into about 127 kW of usable power. This cap applies even if the physical connection could handle more. A 3x250 A connection, for instance, might support up to 173 kW, but if the contractual kVA limit is set lower, the usable capacity remains restricted.
Power Versus Usage
Transmitting Electricity to the Warehouse
1.5 - 2.5W/sq m
Power per Unit
LED-lights Warehouse
33 - 55kW
Total Peak Power (kW)
20W/sq m
60kW
HVAC Offices
7 - 10kW p charger
70 - 100kW
Electric Forklift 10 Units
11kW per charger
220kW
Charging points Electric Cars 20 Units
1.5 - 2.5kW p unit
Loading Docks 22 Units
Miscellaneous Logistics and Office Services
30 - 50kW
Voltage (V) Voltage is the electric potential difference between two points in a circuit. It can be thought of as the “pressure” that pushes electric charges through a conductor. Higher voltages create a stronger push and reduce transmission losses over long distances. Current (A) Current is the flow of electric charge in a circuit, measured in amperes (A). It represents how many electrons pass through a conductor each second. In everyday terms, current is like the volume of water flowing through a hose at a given moment. distances. Power (W) Power is the rate at which electrical energy is transferred or converted into other forms, such as heat, light, or motion. Measured in watts (W), it reflects how much energy (in joules) is used per second. Power is calculated as the product of voltage and current.
Physics 101 - the Difference Between Voltage, Current and Power.
CORE PRINCIPLES
Authority for Consumers and Markets The Authority for Consumers and Markets (ACM) ensures fair competition and protects consumers
national high-voltage grid operated by tso (110kv-380kv)
electricity generation & foreign supply
transformed to medium-voltage grid operated by dsos (1kv-25kv)
transformed to low voltage grid (<1kV)
DELIVERED TO PROPERTY AS MEDIUM-VOLTAGE OR LOW-VOLTAGE
small scale solar and wind parks
on-site electricity production
The National Government The National Government owns TenneT and makes Policy regarding the electricity grid
Real Estate
Utrecht
Take-up (index = 2015)
Average rent
Vacancy
The Hague
Rotterdam
Eindhoven
Grid Congestion
Operational and Financial Risk
Grid Congestion is an Operational and Financial Risk for Industrial Real Estate
Grid capacity issues have left the Netherlands in a state of energy gridlock. Despite TenneT (the national TSO) planning to invest up to €200 billion in the grid by 2034, congestion will impact operations for the foreseeable future. Both businesses and households are already adapting to the consequences.
Grid Congestion Stalls Dutch Growth
For connections above 3x80 A, companies face average waiting times of 65.8 weeks for consumption and 55.4 weeks for feed-in. Smaller connections remain more accessible, with 106,745 new connections added in 2024; however, delays are mounting here. Waiting times for small-scale connections have risen from 30 weeks in 2020 to 40 weeks in 2024. Looking ahead, TenneT expects gradual improvement. Most areas are projected to be free from feed-in congestion by 2030, while adequate capacity for consumption is unlikely before 2032.
Long Connection Delays
Source: Netbeheer Nederland (2025); adapted by Savills Data, Intelligence & Strategy (2025)
Waiting times for small consumers are on the rise, while waiting times for large consumers are decreasing.
Grid capacity constraints have become a nationwide issue, no longer confined to specific regions or property types. As of May 2025, 66.2% of all Postal Code 6 (PC6) areas, the smallest administrative boundary in the Netherlands, face congestion for electricity consumption. Likewise, 89.5% are affected by feed-in congestion. Urban regions in North Holland, South Holland, Gelderland, and Utrecht are under the most pressure. In contrast, parts of Noord-Brabant and Limburg still have available capacity for both consumption and feed-in. For logistics real estate, the impact is even more profound. Approximately 66.4% of logistics properties are in PC6 areas with congestion in consumption. This suggests that additional demand can only be met through on-site generation. Meanwhile, 50.3% are in areas with feed-in congestion, preventing surplus on-site generation from being exported back to the grid. Strikingly, 46.4% of logistics properties experience both forms of congestion, leaving occupiers with limited energy flexibility and making on-site storage increasingly essential.
The Risks From Nationwide Grid Congestion.
Energy Flexibility For investors, developers, and occupiers of logistics real estate, grid congestion is becoming an operational and financial risk. Over 66% of PC6 areas are constrained in electricity consumption, and almost 90% are unable to feed power back into the grid, making energy flexibility essential. Properties in congested zones face long waiting times, which can delay the scaling up of operations or installation of new equipment.
Energy Resilience Matters At the same time, on-site generation risks becoming a redundant asset if surplus power cannot be exported, and DSOs are increasingly charging feed-in tariffs. In this context, long-term property value will depend on energy resilience. Assets with flexible grid contracts, on-site storage, or locations in less congested regions are positioned to outperform. In today’s electrified economy, reliable energy access is fast becoming as critical as location, connectivity, and build quality.
Occupier demand for industrial and logistics real estate has remained steady in recent years. Logistics demand has been consistently strong, with recent softening linked to macroeconomic headwinds and global trade uncertainty. Vacancy rates in logistics have been consistently below 6% since 2018, rising from 4.4% in early 2024 to 5.7% by Q3 2025. The broader industrial market, excluding logistics, has been even tighter, with sub-3% vacancy for the past five years and just 1.4% in Q3 2025. As energy availability becomes a decisive factor in location selection, occupiers increasingly prioritise properties that can meet both current and future electricity needs. This shift is widening the vacancy gap between uncongested and congested areas. In Q3 2025, only 3.7% of logistics stock in unconstrained consumption zones was vacant, compared to 6.9% in congested areas. The difference is greater for feed-in, where 7.1% of logistics stock in feed-in-congested areas was vacant compared to 4.4% where feed-in was available.
Uncongested Areas Experience Tightening Supply, as New Developments Target Congested Areas.
Esli Burggraaf
Commercial Manager
Our clients are increasingly concerned about tenants independently reducing the contracted energy capacity. This aspect is not always adequately addressed during lease negotiations. Some tenants have limited energy requirements and may choose to lower (without consulting their landlord) the contracted capacity, resulting in reduced operational costs. When a tenant vacates the premises, there is a risk that the landlord is left with a diminished contracted capacity, which can negatively affect the property’s marketability. Lastly, we observe extended vacancy periods in properties with low contracted energy capacity. Prospective tenants are becoming more critical in assessing whether the available energy infrastructure aligns with the operational demands of their business activities
The pattern is repeated across the broader industrial market, though less pronounced. Given the sector’s exceptionally tight supply, occupiers often have little choice but to take what is available. The data underscores a growing preference for locations with reliable electricity access, especially in logistics. As grid access becomes central to operational continuity, energy resilience has shifted from being a premium feature to a baseline requirement for occupiers.
Source: Savills Data, Intelligence & Strategy (2025)
Occupiers are showing clear preference for uncongested areas, especially in the logistics market.
Most new industrial and logistics developments are being built in areas already affected by grid congestion. To remain competitive and attract tenants, these projects increasingly need to integrate on-site generation and battery storage from the outset. As of August 2025, 139 logistics properties are in the development pipeline, with only four (2.9%) located in areas with available capacity for both consumption and feed-in.
This does not mean the remaining projects will be entirely without power. In most cases, a basic 3x80 A connection, providing roughly 47 kW (with a power factor of 0.85), is available. This capacity is well short of the needs of logistics tenants occupying average building sizes of around 35,000 sq m. The gap between tenant energy requirements and grid availability underscores the urgency of integrating energy solutions into new developments.
The Dutch Senate approved the new “Energiewet” (Energy Law) on 10 December 2024, with implementation phased in from 2025 and the law entirely in force by 2026.
The new law is expected to enhance the electricity system, offering greater contractual and operational flexibility, particularly in facilitating power-sharing. Much of today’s congestion results from administrative overbooking rather than constant physical overload. Therefore, more flexible contracts and collective usage models could significantly ease pressure on the grid. A central innovation for the industrial and logistics sectors is the formal recognition of energy hubs. These are clusters of businesses, typically located in the same industrial park and linked via a shared substation. They can now operate as a single legal entity in their dealings with grid operators. This enables them to contract capacity collectively and redistribute it through intra-hub power-sharing agreements.
The Energy Law introduces a range of broader reforms to the Dutch energy market. It also introduces several new contractual tools that are especially relevant for industrial and logistics companies.
Group Transport Agreements (GTO – Groepstransportovereenkomst): enable multiple users within an energy hub to pool and redistribute contracted electricity capacity among themselves.
Capacity-Limiting Contracts (CBC – Capacitietsbeperkend contract): allow businesses to voluntarily reduce their consumption during peak grid load periods in exchange for financial compensation.
GTO
CBC
Alternative Transport Rights (ATR – Alternatieve transportrechten): include time-blocked and duration-based capacity contracts, allowing access to grid capacity at specific times of day or for defined seasonal periods.
ATR
GOTORK
Use-It-Or-Lose-It (GOTORK – Gebruik Op Tijd Of Raak het Kwijt): enables grid operators to reclaim unused reserved capacity and reallocate it to companies with active demand. It will help unlock capacity for new or expanding logistics operations.
Further flexibility is enabled through:
Lastly, the law introduces the concept of Congestion Service Providers (CSP – Congestion Service Provider). CSPs are specialised intermediaries helping businesses manage their energy profiles to align with real-time grid conditions.
For logistics and industrial stakeholders, this regulatory shift reframes grid capacity as a flexible and optimisable asset. This collaborative, technologically and data-driven approach helps operations run smoothly while potentially unlocking significant financial and operational efficiencies.
Percentage of Logistics Properties Experiencing Grid Congestion - Feed-in
Percentage of Logistics Properties Experiencing Grid Congestion - Consumption
In early 2025, TenneT reported 11,922 pending requests for new connections and 8,440 pending requests to feed electricity back into the grid (feed-in) at capacities above 3x80 A. Congestion affects users seeking to consume electricity as well as those trying to return electricity, often from on-site renewable production.
Conclusion & Outlook
Industrial and Logistics Real Estate
Are Part of the Solution
The complexity of Dutch grid capacity issues makes it increasingly difficult for occupiers, investors, and developers to secure properties that guarantee operational stability. Investments in grid access are often substantial and must be tailored to specific tenant requirements, with some occupiers needing far more advanced or larger-scale systems than others.
In practice, long-term viability now depends on combining on-site electricity generation and storage with electricity-sharing agreements. Without sufficient electricity availability, a property risks becoming unattractive to tenants, with potential income losses that may far outweigh the upfront investment in energy infrastructure. It is also essential to recognise that every project is unique. The figures presented earlier are simplified examples designed to illustrate the challenges facing the sector. In reality, electricity demand profiles, cost structures, and generation potential vary widely.
Flexibility in accommodating occupiers’ electricity requirements should become a key characteristic of industrial and logistics properties. At the same time, electricity demand from industrial and logistics clusters is set to rise sharply. While the exact scale depends on how effectively supply and demand can be balanced, the effects of electrification and greater self-sufficiency point to rapid growth. TNO projects that industrial demand could nearly triple from 43 terawatt hours (TWh) to 128 TWh by 2030, or around 80% of current electricity consumption. The sector is capable of overcoming current constraints and actively help ease grid congestion while preparing for a future of higher electricity demand. Industrial and logistics real estate can assume a strategic role in building a more resilient and sustainable energy system by enabling decentralised consumption and generation. This opportunity extends to both new developments and the redevelopment of brownfield sites, many of which remain dependent on natural gas. The new Dutch Energy Law introduced the integration of on-site renewable generation, storage solutions, and electricity-sharing mechanisms. Therefore, assets can be future proofed for more tailored, flexible, and sustainable energy use.
Dutch industrial and logistics real estate needs to adapt to grid capacity limits to sustain the sector’s role in the broader economy.
One of the clearest examples of successful electricity-sharing in the Netherlands is the Virtual Net at Schiphol Trade Park, launched by the Schiphol Area Development Company (SADC). Here, companies participate in a collective power-sharing scheme that allows them to use grid capacity jointly. Many businesses cannot obtain a sufficiently strong individual grid connection to meet their demand because others have already reserved the contractual capacity. In practice, these reserves are rarely used in full, as companies seldom run all their equipment at maximum output simultaneously.
The uncontrolled growth of on-site systems is problematic, but businesses and property owners should still consider the benefits of installing their own generation or storage solutions. Where grid connections are insufficient, such supplementary measures may be essential to safeguard resilience.
On-site and supplementary electricity generation has become a critical element of industrial and logistics real estate strategy, especially for speculative developments that can initially secure only a basic 3x80 A grid connection, supplying roughly 47 kW (assuming a power factor of 0.85). For most occupiers, this capacity is far below what is needed to support standard operations. An increasingly common solution is the integration of solar PV panels with on-site battery storage. This combination allows peak demand to be met with self-generated electricity while surplus electricity is stored for later use, strengthening both efficiency and resilience. In some cases, additional redundancy is still provided by back-up diesel or gas generators, which can maintain operations when solar and storage systems fall short. Dependence on fossil-fuel back-up may gradually diminish with the introduction of new contractual mechanisms under the Energy Law. These include Group Transport Agreements (GTOs) and Alternative Transport Rights (ATRs). These tools can provide the same flexibility and reliability while supporting the shift away from carbon-intensive solutions when applied effectively.
On-site Solutions to Ensure Operational Stability.
Physical and Virtual Energy Hubs Facilitating Electricity Storage and Generation
To address this inefficiency, SADC introduced an innovative system that measures real-time electricity use and dynamically reallocates capacity whenever demand peaks. This “virtual grid” ensures that available power is optimised across the site rather than locked into individual contracts. As more occupiers install on-site generation and storage, the case for collective usage grows stronger. Traditional models leave contracted capacity underused, while shared models prevent the fragmented rollout of solar PV, batteries, and diesel or gas backup generators. They encourage efficiency and relieve spatial pressure on business parks. The Schiphol model is already inspiring similar initiatives. In Tholen (Zeeland), Stedin is working with local businesses to jointly purchase, store, and distribute electricity. At Fresh Park Venlo, real estate owner Hines, grid operator Enexis, and tenants are collaborating on data-driven optimisation to match supply and demand. DSOs and TenneT are likewise developing the digital and physical infrastructure needed to scale these agreements nationally. These models require active cooperation among businesses to succeed. Since most occupiers are not energy specialists, an intermediary is needed to coordinate efforts, and park managers are suited to perform this role. Many Dutch business parks already engage in active site management, which can now extend to coordinating shared energy use. Their participation will be crucial in developing a decentralised, flexible grid that ensures continuity and fosters growth.
Shared Energy Park Models
Jaimy Rengers
Associate Director Savills Building & Project Consultancy
When developing or redeveloping logistics buildings affected by grid congestion, it is critical to align on-site energy generation and storage systems with both the base building’s energy requirements and the anticipated demand of future tenants. A mismatch in investment, whether under or over, can lead to reduced tenant appeal or diminished financial returns. Therefore, a solution must be identified that is both technically sound and economically viable.
Savills Building & Project Consultancy provides expert support to developers and owners in navigating grid congestion challenges. Our approach integrates capacity planning with capital expenditure strategies to ensure energy resilience, operational continuity, and long-term investment value.
The standard logistics property referenced earlier, 22,000 sq m of warehouse space and 3,000 sq m of offices, requires a maximum load of around 450 kW. With only a basic 3x80 A grid connection in place (roughly 47 kW), the building faces a shortfall of more than 400 kW. In such cases, combining solar PV with battery storage offers a practical solution. Assuming 60% of the roof (15,000 sq m) is used for solar PV, a conservative packing density would allow the installation of around 4,100 panels of 440 Wp each, providing roughly 1.8 MWp of capacity. Under Dutch irradiation conditions (85%), this system could generate approximately 1,530 MWh annually. While this contribution is substantial, it does not align perfectly with demand: production peaks in summer, while the highest loads typically occur in winter. As a result, additional backup capacity, most often in the form of diesel or gas generation, remains essential. To cover peak demand when solar generation is insufficient, the system would need to be paired with a battery capable of discharging at least 400 kW. In practice, batteries cannot fully bridge seasonal gaps and scaling them up leads to diminishing returns. An economic optimisation might show that a 1,000 kWh battery, combined with roughly 100 hours of annual generator use, is more cost-efficient than doubling or tripling battery size to achieve only marginal reductions in generator runtime. A balanced mix of storage and backup generation is therefore often the most viable approach, particularly during the darkest months of the year. The financial implications are significant. Depending on design and technology choices, a combined PV and battery system with a backup generation can quickly require several hundred thousand euros in investment. Operational costs must also be considered: frequent reliance on backup diesel or gas generators not only raises expenditures but also undermines sustainability, making them a less attractive long-term option.
4,100panels - 1.8MWp
Rows of solar panels covering ~60% of the roof
100hrs annual use
Backup Generators
Policy / Contracts Energy Law tools: GTOs / ATRs
1,000kWh / 400kW discharge
Battery Storage Unit
3x80 A ≈ 47kW
Grid Connection
Required: 450kW
Electric Demand Indicator; shortfall (~400 kW).
Grid
Solar
Battery
Generator
Energy Systems in a Logistics Property
Savills Data, Intelligence & Strategy Our independent Data, Intelligence & Strategy team solves all of your real estate issues. We work together with developers, investors, municipalities and occupiers and offer them high-quality, highly detailed customized analyses without losing sight of the strategic question. Our advice is based on a solid combination of reliable data and in-depth market knowledge of the various market segments within the real estate market. In our analyses we focus on factors that influence the supply and demand of real estate. The product we deliver always depends on your wishes. We offer a wide variety; from a smart one-pager, an extensive research report to a tailor-made dashboard. Our product will support you in making well-founded property decisions.
+31 6 2788 2408] niek.poppelaars@savills.nl
Niek Poppelaars
Head of Savills Logistics & Industrial
Contact
+31 6 4311 8577 j.rengers@savills.nl
Associate Director Building & Project Consultancy
+31 6 1546 6809 esli.burggraaf@savills.nl
+31 6 2035 1893 maarten.bulstra@savills.nl
Maarten Bulstra
Associate Logistics & Industrial
Grid congestion is one of the most pressing structural issues for the Dutch industrial and logistics sector, heightening both operational and financial risks for businesses.
Yet it does not stand alone. An unstable political environment following the fall of the Schoof Cabinet, new trade tariffs on U.S.-bound exports, persistent labour shortages, rising construction costs, and the nitrogen emissions crisis all add further layers of complexity and risk. Previous research by Savills shows that nearly all industrial and logistics properties in the Netherlands lie within 25 kilometres of a Natura 2000 protected area. This means all construction projects are subject to strict environmental regulation and complex permitting processes. Combined with grid congestion, these pressures underline the need for stakeholders in the industrial and logistics market to adapt.
Fortunately, concerns about grid capacity have risen up the political agenda. It is unlikely a new Dutch cabinet will reverse measures aimed at relieving pressure on the electricity system. The new Energy Law already gives businesses more flexibility in managing their electricity use. However, companies operating in the industrial and logistics sectors are not electricity providers. Park managers will be increasingly central to coordinating and optimising energy use. Savills believes the sector can play a decisive role in easing grid congestion. On-site generation and storage reduce dependence on heavy grid connections. In addition, algorithm-driven energy management can optimise consumption and cut both costs and CO₂ emissions.
Meanwhile, the revision of the EPBD IV will further raise the bar. The Netherlands must incorporate most of its provisions by summer 2026. Consequently, from January 1, 2030, new industrial and logistics buildings will not be permitted to emit fossil-fuel-based emissions. Solar PV installations will be mandatory where feasible. This is a positive step towards a more sustainable sector, but it also brings new challenges for developers, investors, and occupiers. Operational stability will increasingly depend on recognising grid limitations early, during design, construction, leasing, or renovation. Collaboration between property owners and tenants will be essential to identify solutions, test their feasibility, and ensure compliance with future regulations.
Sustainable Energy Grid Solutions
Source: Savills Data, Intelligence & Strategy (2025) (Concerns only logistics properties. Outliers in electricity use per sq m per year have been omitted from the chart for the sake of readability).
98.7% of Dutch Industrial and Logistics properties lies within 25 km of a natura 2000 area, causing (re)developments to be subjective to strict permits.
Waiting for the government, TenneT, or DSOs to solve grid congestion is not realistic. These efforts will take years, while the bottlenecks are already here. Stakeholders should therefore address the challenge now, proactively ensuring long-term value through stable operations, resilient assets, and sustainable growth.
Claude Debussylaan 48, 1082 MD Amsterdam +31 (0) 20 301 2000
Mon - Fri: 9:00am - 6:00pm
Office opening hours
+31 6 11403965 c.demos@savills.nl
Charlotte de Mos
Head of Marketing & Business Intelligence
+31 (0) 6 1204 7594 wouter.grunewold@savills.nl
Wouter van ‘t GrunewolD
+31 6 1170 4967 iris.kampers@savills.nl
Iris Kampers
Head of ESG and Sustainability
LONG TERM VALUE
THROUGH GRID RELIEF
For additional insights, tune in to this special episode of our podcast.